The municipal market has started strong in 2021, much like it started and finished 2020. As for the middle of 2020, we are pleased we were able to take advantage of market weakness during that time.
Munis have outperformed their benchmarks year-to-date, due to low new issuance and strong inflows of cash. MainLine believes munis are finally receiving the love they have earned.
Muni and corporate bonds, as measured against various benchmarks, look to be “rich” and, therefore, overpriced. MainLine will not speak to the value of corporates, but this seems to be a good time to explain the muni yield ratio, how it is calculated, what it means, and what we think it means going forward. By definition, the muni-taxable ratio compares the current rates of municipal bonds with the current rates of taxable bonds and is a helpful tool for deciding which is a more attractive investment at the moment. History does not always explain the future, but then again, how low can the ratio go?

Muni Market Review
The muni market continues to redefine its value versus taxables, outperforming and taking yield ratios close to all-time lows. MainLine believes the performance of the municipal market is due to strong technicals and better fundamentals. Highlights from January’s muni performance are as follows:
- Muni yields were virtually unchanged as taxable rates were higher by 9 to 20 bps. This outperformance has led to low yield ratios, which we discuss in details below.
- In early 2021, supply is running lower than average, and demand is higher:
- Issuance is 16% lower than 2020, 25% lower than the five year average.
- Muni fund inflows are higher by 23% versus 2020 (over ½ billion).
- Credit default swaps on average have tightened from 15% to 18% over the last 30 days. Investors feel credit quality is (and will continue to be) improving. MainLine feels munis will continue to perform well for at least the next 30 to 90 days. The political winds in DC, market technicals and perception of credit quality are all blowing in favor of munis.
Market News and Credit Update
- The city of Chicago issued a bulletin that better outlined the policies and enforcement of its “Netflix Tax”. Officially called the Amusement Tax (Ruling #5), this was designed to tax streaming entertainment services and personal property lease transactions but has been tough to understand and implement. This recent guidance will clarify who owes what, give exemption to the smaller services, and provide better enforcement going forward. MainLine feels there will be cities near you that will be introducing this tax in the near future.
- Muni yield ratios are sitting at or near all-time lows just as corporate yield ratios are. According to ICE BofA index data the “Sherman Ratio”, which measures a corporate bonds yield to its duration, is at .23, compared to its historical low (12/31/20) of .215. Does this mean both are rich and will underperform in the future? While we are not sure about corporates, we will examine munis below.
- Is there a crisis in tax-exempt money markets? Issuance has greatly decreased over time in variable demand notes (from $119 billion in 2008 to $8.3 billion in 2020) causing lower yields and less supply. The ability to issue long-term debt at 1.5%, combined with large inflows of cash into muniland, has 7-day munipsa rates at near lows and rich, as a ratio to taxables. This is very beneficial for the MainLine West Family of Funds, providing lower financing costs that should boost payout over the time.
Muni Ratios, How Low Can They Go?
Introduction:
When compared to historical averages, municipal bonds yields along the curve, as compared to taxable yields such as USD swap rates and US Treasuries, are showing munis to be “rich” versus taxables.
There are many advisors and investors calling for a sell-off in the muni market and underperformance, going forward. MainLine feels that is not necessarily the case, and that muni yield ratios can go lower and stay there for some time. What is the muni ratio? What does it mean? What does MainLine think, and why?
Background:
MainLine refers to the “muni ratio” quite often as a way to identify if munis represent value. It is especially important for the MainLine West Family of Funds investment strategy. Let’s step back and show our readers what the ratio we use means. Then, we can review where it is now, and what it means to our investment strategy.
Below is a simple chart showing the calculation of muni yield ratios for a few maturities. It takes the like-term yield on a AAA muni bonds and divides it by the USD Libor swap curve rate.
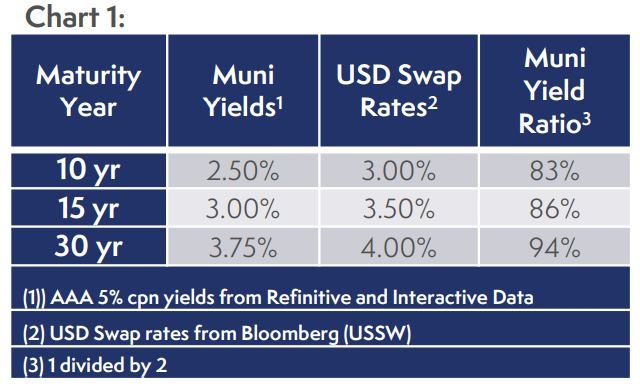
In Chart 1, the 10 year muni ratio is 83% (2.50%/3.00%). This means the muni yield is 83% of the USD Libor rate. 30 year is at 94%. In the muni market, the longer the maturity, the higher the ratio, due to increased uncertainties in muniland in 30 years versus 10 years.
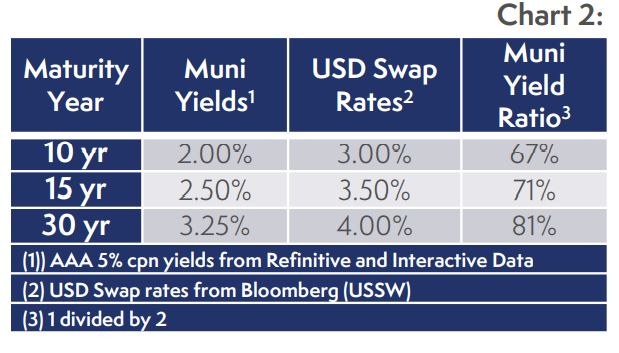
In Chart 2 we change muni yield to be lower by 50 bps. The 10 year ratio moves to 67% (2.00%/3.00%) versus 83%. This means munis have outperformed, having gone down in yield by 50 bps, causing prices to increase while USD rates were unchanged. The lower ratio from Chart 1 reflects this outperformance.
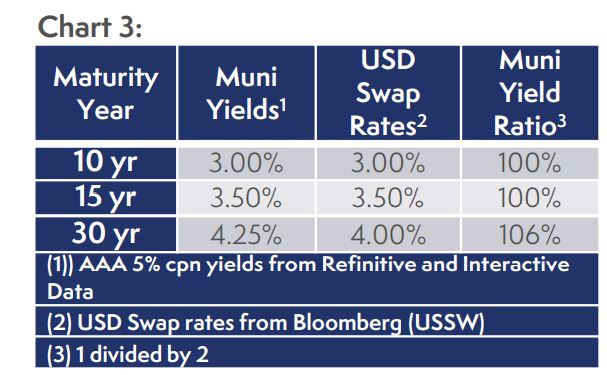
Now, we change muni yields to be higher by 50 bps in Chart 3. The 10 year ratio goes to 100% (3.00%/3.00%) versus 83%. This means munis have underperformed, having gone up in yield by 50 bps, causing prices to decrease while USD rates were unchanged. The higher yield ratio reflects this underperformance.
Analysis:
Now, let us compare current muni yield ratios with historical averages. The chart below shows ratios as of 1/31/2021 compared to one year ago, last 10 years, “Historical” (since May 1993) and the lowest the ratio has been, historically.
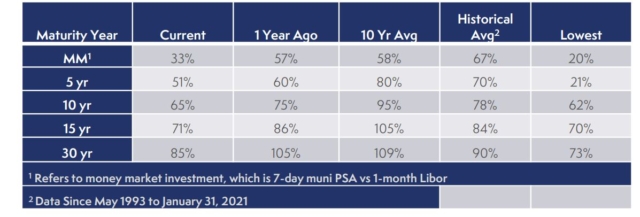
In the chart above, current yield ratios look rich versus averages and are close to all-time lows. MainLine feels the lower than average ratios can be justified for the foreseeable future. MainLine feels muni ratios, going forward, will be lower than historical averages due to several strong “revaluing” events over the last couple of years, and in the near future. What does MainLine see today to justify “rich” munis in the future?
- Credit quality is confirmed and the fundamental of muni finance has been validated. The economic meltdown in 2007-2008 did not cause a large increase in defaults and losses in muniland. We feel the COVID crisis of 2020 will not cause them either. This, combined with another stimulus package, has reminded the investment community of the sleep well at night principal protection strength for the right type of muni issuers. This creates an improved credit quality, realizing a AA rate muni is much stronger than a AA corporate bond – and at a lower yield ratio.
- Prospects of higher taxes. The higher the tax, the more valued tax-exempt income is. Therefore, a lower muni yield provides the same “tax equivalent” yield it did in the past at a lower tax rate. Higher taxes mean lower muni yields, which means a lower yield ratio.
- The prospect of higher interest rates usually means muni outperformance. Historically, muni yield ratios are, on average, lower when taxable rates increase. The higher the taxable rate, usually the lower the ratio. This is due to the math, when calculating tax equivalency, and how higher rates favorably impact muni supply and demand technicals – adding value and lowering the yield ratio.
Conclusion:
Stronger perceived credit quality, improved tax-efficiency, and strong supply and demand technicals make munis a better value versus other fixed income investments today and going forward. How low can the ratios go? Let us just say lower and for longer over the near future. Keep limber and in the muni game, munis will remain an outperformer and still represent good value.
View the Monthly Review PDF here.

This document is for informational purposes only and is summary in nature. It does not contain all material information and considerations relevant to an investment in MainLine West Tax Advantaged Opportunity Fund IV LLC (“The Fund”). No representations or warranties express or implied, are made as to the accuracy or the completeness of the information contained herein. Any prior investment results presented herein are provided for illustrative purposes only and have not been verified by a third party. Further, any hypothetical or simulated performance results contained herein have inherent limitations and do not represent an actual performance record. Actual future performance will likely vary and June vary sharply from such hypothetical or simulated performance results. This document does not constitute an offer to invest in securities in the fund. No offer of securities in the fund can be made without delivery of The Fund’s confidential private placement memorandum and related offering materials. An investment in securities of The Fund involves risk, including potential risks that could lead to a loss of some, or all, of one’s capital investment. There is no assurance that the fund will achieve its investment objective. Past performance does not guarantee future results. There can be no possibility of profit without the risk of loss, including loss of one’s entire investment. There are interest and management fees associated with an investment in The Fund which are disclosed in The Fund’s offering materials.