April 2020 –“Good Days/Bad Days and the Power of the Muni Ratio”
The muni market healed slowly in the month of April, with good and bad days along the way. The front-end liquidity lock-up has been fixed; the primary market appears to be coming back, but there remain “distressed sectors” that are still having problems finding a bid. Fund flows for the month are still slightly negative. The market is fragile, but it is moving forward and MainLine continues to surf its waves daily. Stay safe with your bonds and with your health.
The MainLine West Opportunity Funds have been quite active the last 30 to 60 days: liquidating positions in Fund IV, calling deleveraging capital for Fund V, and making purchases for Fund VI. MainLine felt this would be a good time to review the muni to taxable yield ratio and the power behind it when it comes to the management of our Funds. This ratio is the basis for the possible realization of gains or losses (NAV return) that a Fund can realize beyond the tax-exempt payout. This ratio set a new all-time high in the last 30 days, providing a great opportunity for Fund VI. How great this opportunity is and the NAV returns available depends on how the muni market heals and the investment strategy we have deployed.
Muni Market Review
In April, the muni market remained delicate and proceeded forward with good and bad days. By month-end, it felt like things improved, but remains tense. The month started with a good recovery rally and then sold back off, causing month-end changes to look a bit manageable but with big underperformance. Along the way, the ride was bumpy:
- Muni yields are higher and the curve steepened from 0 to 29 bps.
- Taxable yields were mixed, higher 11 to 14 bps from 10 to 20 years, lower by 4 bps in 25 years, and unchanged in 5 years.
Good and bad days timeline:
- End of March Federal Reserve Bank announced a $500 billion plan to support the liquidity of muni bonds. This helped reverse the liquidity crisis munis were having, due to lack of cash from outflows in high yield mutual funds.
- April 1st the short-term 7-day muni rate plunges back to 1.83% from 5.20% two weeks ago, and is on its way to 20 bps by the end of the month.
- April 2nd-The last day of a three day 65 bps sell off.
- April 13th–Muni market finally has a week where yields each day went lower.
- April 23rd-Mitch McConnell announces his preference for states to seek bankruptcy and does not promise any further aid to municipalities.
- April 27th -Federal Reserve Bank expands it program to include smaller municipalities.
- April 30th–The first new issue deal greater than $1 billion in size is underwritten; the primary market is finally coming back.
MainLine feels the muni market is continuing to recover, but we also think it will not be a linear progression. Fund VI will continue to look to invest for the right bonds at the right price and we encourage our clients to do the same.
Market News and Credit Update
Part of the increase in the volatility of muni yields and fund flows are a result of the increase in Fund concentration risk. Mutual Funds are estimated to manage over 25% of the muni market; of the 25%, nine fund families control 42%, with Vanguard representing 20%. This concentration risk greatly influenced the latest muni market crisis. Once the COVID-19 hit the economy, Nuveen’s high-yield fund suffered roughly $3.3 billion outflows over three weeks in March, causing bond sells and further price declines. This one fund’s actions, being such a big part of the muni high yield market, triggered the liquidity crisis the muni market.
Airports have been selling at distressed levels, as investors are concerned with their ability to pay debt back as air traffic has plunged. Moody’s released a report in early April that revealed the strong liquidity positions that most of the major airports have. The weakest was Wayne County (Detroit), which had roughly 20 months of cash on hand; the strongest was Houston Airport at close to 80 months. On average, most major airports had roughly 40 months of cash on hand. This gives them a very big cushion to ride out the virus.
States and municipalities are going to be facing a big shortfall in revenues and there will be credit quality downgrades, but we are not worried at this time about defaults. Senior living facilities, small colleges, new project developments, and non-essential appropriation bonds are examples of sectors that could see an increase in defaults. If you have any question or concerns about your bonds, please give us a call.
The Power of the Muni Yield Ratio:
Introduction:
The muni yield ratio is the percentage that munis trade at versus taxable equivalents. This is the biggest factor in our Fund strategy to realize the extra return (NAV appreciation) the Fund hopes to provide its investors aside from the tax-exempt cash payout. More specifically, it is a ratio calculated by dividing the 15-year muni yield by the 10-year US dollar swap rate. For example if muni yield is 2% and the Swap rate is 1%, the ratio is 200%. The long-term average is closer to 95%. The trade begins when this ratio is high versus historical values and over time, as it decreases to its historical average, the muni outperformance provides this added “NAV appreciation”.
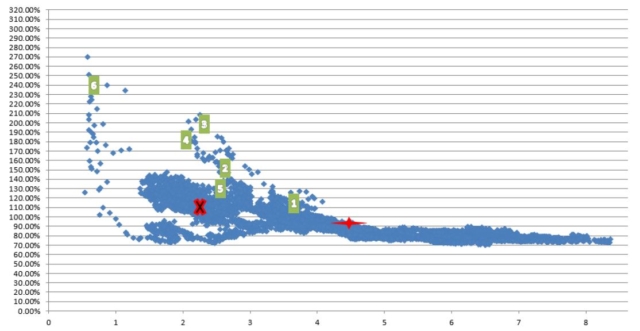
Below is a scatter graph showing the history of the ratio versus the level of the 10-year US Government yield. We have also identified each Fund’s average investment ratio for comparison purposes represented by the number. If you read our Fund Spotlight on Basis Risk in the November 2018, the concept of the muni ratio and basis risk will make a lot more sense. The muni ratio is on the Y-axis and the level of US Treasuries 10 year yield is on the X-axis. The Red Cross is the historical average, the red “X” is the five-year average.

Observations:
- The lower the US Treasury yield, on average the higher the ratio.
- We had to truncate the graph; there are some points above the cut off 320%. These are all within the last 60 days.
- The ratio is a lot more volatile when rates are lower.
The COVID-19 muni market crisis brought the maximum muni yield ratio of 392%, the highest level recorded since the data we track began in June 1991. This identified a great opportunity for Fund VI. Does this mean the NAV return prospects for Fund VI is the best of any of the Funds? Not necessarily -we need to do the math first. Different yield levels can cause different yield ratios. In addition, there are different ways for the muni outperformance to occur, which will influence returns. For example, do muni rates decline to the swap rates, or do swap rates go up and meet muni rates to get to the average long-term ratio? This will influence a Fund’s returns.
We will look at how this ratio normalizing can influence the Funds returns. To do this, we will look at some hypothetical scenarios and in the end; make a few hypothetical NAV performance outlooks for Fund VI.
Data Analysis:
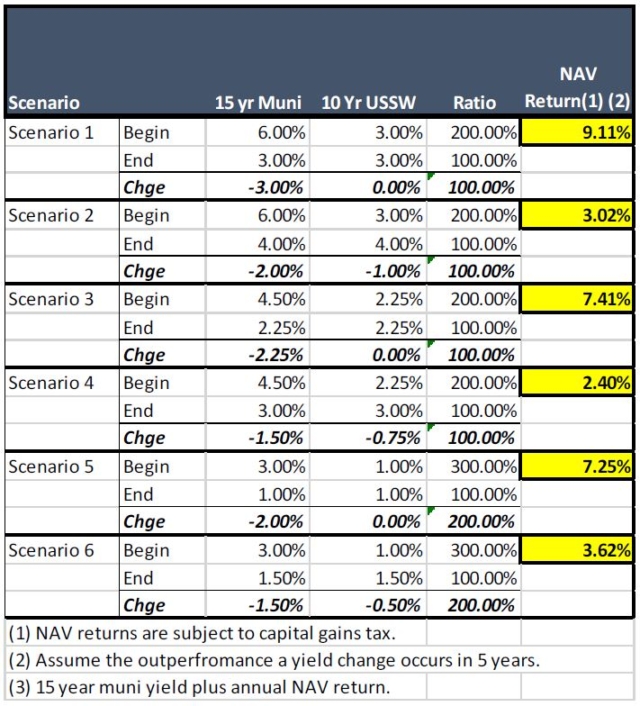
The analysis below models six scenarios, three at different rate levels each with two different outperformance outcomes. The different outcomes look at which part of the investment (muni or swaps) changes to create the outperformance. This will be a way to see which outperformance is best for the Fund and its investors. Below is the table of results:

Scenarios description and results are as follows:
- Muni rates start at 6%, swaps at 3% and a ratio of 200%. Munis go down 300 bps to 3.00% to a ratio of 100% in 5 years and swaps are unchanged. This 300 bps of outperformance can add 9% annualized NAV return.
- Muni rates start at 6%, swaps at 3% and a ratio of 200%. Munis go down 200 bps to 4.00% to a ratio of 100% in 5 years with swaps going up to 4.00%. This 300 bps of outperformance between the two different investments can add 3% annualized NAV return.
- Muni rates start at 4.50%, swaps at 2.25% or a ratio of 200%. Munis go down 255 bps to 2.25% to a ratio of 100% in 5 years with swaps unchanged. This 225 bps of outperformance can add 7.4% annualized NAV return.
- Muni rates start at 4.50%, swaps at 2.25% or a ratio of 200%. Munis go down 150 bps to 3.00% to a ratio of 100% in 5 years with swaps going up 75 bps to 3.00%. This 225 bps of outperformance can add 2.40% annualized NAV return.
- Muni rates start at 3.00%, swaps at 100% or a ratio of 300%. Munis go down 200 bps to 1.00%, to a ratio of 100% in 5 years with swaps unchanged. This 200 bps of outperformance can add 7.25% annualized NAV return.
- Muni rates start at 3.00%, swaps at 1.00% or a ratio of 200%. Munis go down 150 bps to 1.50% to a ratio of 100% in 5 years with swaps going up 50 bps to 1.50%. This 200 bps of outperformance can add 3.6% annualized NAV return.
Observations:
- The ratio change is important, but the level of rates, and which component of the trade does the work (muni or swap) is just as important. More specifically:
- At a higher level of rates, the amount of basis points needed to change the ratio is bigger. The more bps that change in an outperformance, the bigger the NAV gain. Scenario 1 had the ratio go from 200% to 100%, but it took 300 bps to do it. This is why it is the top returning scenario.
- The way the Fund hedges the munis and the change in price of the munis and swaps when yields change, is also important. The strategy of the Fund is to take advantage of munis being out of favor, and therefore the Fund performs best when munis do the work. More specifically, if the ratio move to 100% is all due to the munis doing well and the swaps not changing, then the NAV gain for the Fund is maximized. This can be seen by looking at each of the scenarios and comparing. For example, Scenario 1 is where all the change in rates is by munis, versus scenarios 2, where munis and swaps change to get to the same ratio.
- A voice of reason must also be inserted here. There are other aspects of the Fund strategy that can affect NAV and total return outcomes. Items such as:
- Funding costs and cash payout.
- Credit quality and yield spread changes.
- Realization of gains or losses on bond sells and swap terminations.
- Amount of leverage used and hedging ratio.
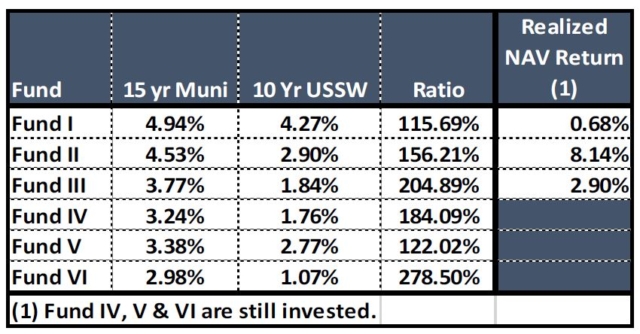
Fund NAV Performance History:
 Conclusions:
- We are investing Fund VI at the highest ratio of all of the Funds, giving it a good start towards NAV appreciation. Unfortunately, it is at a lower level of interest rate but it does have a potential 200 bps of outperformance.
- Fund VI’s hypothetical performance, tying in the aspects of the trade describe above (ignoring the other influential items also listed above) are as follows:
- If munis can do all of the work, go down 200 bps versus the swap rates unchanged, the NAV appreciation opportunity is estimated to be 7%. Add this to an estimate tax-exempt payout of 5%, its total return could be close to 12%.
- If munis yields go down 150 bps, and swap rates go up 50 bps, the NAV appreciation opportunity is estimated to be around 4%. Add this to an estimate tax-exempt payout of 5%, its total return could be close to 9%.
View the Full Monthly Report PDF here.

This document is for informational purposes only and is summary in nature. It does not contain all material information and considerations relevant to an investment in MainLine West Tax Advantaged Opportunity Fund IV LLC (“The Fund”). No representations or warranties express or implied, are made as to the accuracy or the completeness of the information contained herein. Any prior investment results presented herein are provided for illustrative purposes only and have not been verified by a third party. Further, any hypothetical or simulated performance results contained herein have inherent limitations and do not represent an actual performance record. Actual future performance will likely vary and June vary sharply from such hypothetical or simulated performance results. This document does not constitute an offer to invest in securities in the fund. No offer of securities in the fund can be made without delivery of The Fund’s confidential private placement memorandum and related offering materials. An investment in securities of The Fund involves risk, including potential risks that could lead to a loss of some, or all, of one’s capital investment. There is no assurance that the fund will achieve its investment objective. Past performance does not guarantee future results. There can be no possibility of profit without the risk of loss, including loss of one’s entire investment. There are interest and management fees associated with an investment in The Fund which are disclosed in The Fund’s offering materials.