After SMAs, ETFs have been all the rage in muniland over the past five to six years. On average, they’ve grown 25% per year in assets, while municipal mutual funds are up only 4%. Over the last decade, ETF fund flows have climbed from just 10% of total weekly muni flows to more than 50% – and they’re still rising. Why have they become so popular compared to mutual funds? Are they truly a better choice for investors seeking municipal tax-exempt income? Do their lower fees translate into higher returns than actively managed mutual funds? MainLine set out to find the answers. What the ETF???

Munis kept up their comeback after a tough start to 2025, posting another strong month of gains. They’ve already made up more than half their earlier losses, with solid fundamentals and supportive market trends heading into year-end. MainLine believes they could close the nearly 5% performance gap in just four months. Now that’s what we call a fourth-quarter rally!
Muni Market Review
Munis are still making up ground after a slow start to 2025, posting their second straight month of outperformance. Momentum looks strong heading into year-end. For the month, Munis gained 1.24% (Bloomberg Muni Composite Index), compared to 0.62% for U.S. Treasuries and 0.38% for U.S. Corporates. Year-to-date, Munis have returned 3.91%, still trailing Treasuries at 6.01% and Corporates at 7.29%.
Other October performance highlights:
- The Muni yield curve has been the real performance story over the last 30 days. The short-end is up 6 bps in yield, the intermediate (10-15 yrs) is down 20 to 25 bps, and long Munis down 9 to 11 bps
- Taxable yields were unchanged for the month.
- Housing (5.33%) and Transportation (4.01%) are top performing sectors year-to-date, Hospital (3.27%) and Electric Utility (3.38%) are worst performers.
- Year to date issuance is still up 8% from 2024 and 25% higher than the five-year average. It continues to slow down but is still on pace for a record year.
- Muni demand, ETF and mutual fund flows remain steady, muni fear indices remain low, and the Fed cut signals to retail investors that yields are on their way down.
For the month, Mainline estimates the Tax Advantaged Opportunity Funds’ NAVs were up roughly 5% reflecting the outperformance of munis, and their intermediate curve exposure.
Market News & Credit Update
- Reinvestment demand for November and December is expected to top $42 billion each month, while new issuance is forecasted in the mid-$30 billion range. That imbalance should keep munis well supported through year-end.
- The setup looks strong on both technical and fundamental fronts. There’s still plenty of cash on the sidelines waiting to be invested. Tax-exempt money market fund assets have jumped 65%, from $85 billion to $140 billion, since early 2022 when the Fed began raising rates. As short-term yields fall with recent Fed easing, investors seeking to maintain income will likely move further out on the muni curve. Nobody likes to take a pay cut—especially retirees or those living on fixed income.
- The “bad boy” of muni credit just earned a gold star. Illinois was upgraded by Moody’s from A3 to A2 for raising reserves and improving finances. Still the lowest-rated state, Illinois trades at nearly three times the credit-default swap spread of the next-closest state (199 bps vs. 69 for New Jersey). The upgrade highlights improved fiscal discipline and shows that, despite its challenges, even Illinois is moving in the right direction.
October Muni Monthly Review – What the ETF?
MainLine analyzed the growth of the ETF industry over the past decade and found that much of this expansion has come at the expense of traditional mutual funds. The big question is: why are ETFs gaining ground, and do they really offer advantages that make them more appealing to investors seeking tax-exempt income?
MainLine’s review focuses on the following:
- The change in the percent of total muni assets held by different fund types.
- The percent of weekly flows from each type of fund.
- The perceived benefits of ETFs versus mutual funds
- The total returns of ETFs versus mutual funds.
Holders of Muni Bonds:
Individual investors still make up the largest share of the muni market, holding about 45% of total outstanding bonds, down slightly from 47% ten years ago. Fund ownership has grown modestly, rising from 23% to 27% over the same period. The biggest shift, however, is within that fund category: ETFs now represent a much larger share of muni exposure.
Chart below: stacked bar showing percent of ownership by fund type at year-end.)
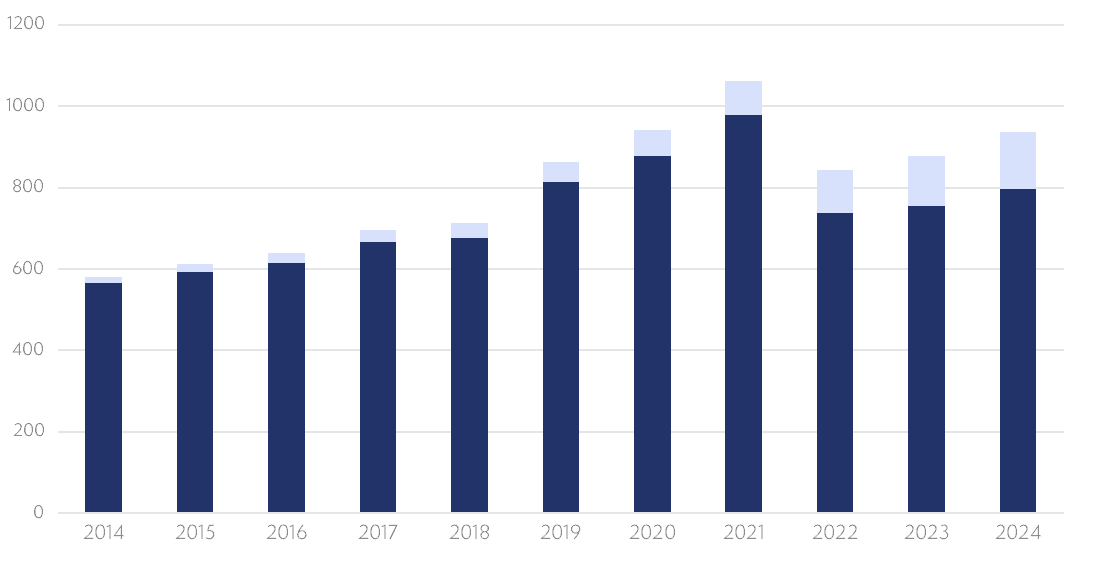

The graph/chart shows:
- ETFs have grown from 2.6% of fund holdings in 2014 to 14.8% in 2024. Growth continues to trend up close to 1% higher each year.
Weekly Fund Flows by Type:
Which fund type is driving weekly demand? Below is a graph showing the weekly in- and outflows for each type of fund.
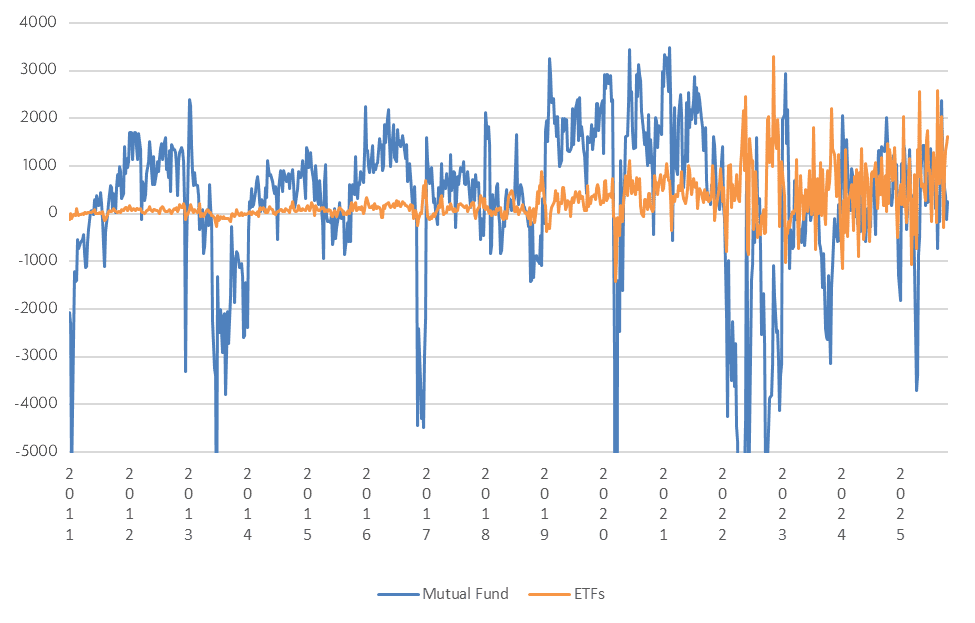
This graph shows that the orange line has now moved in sync with the blue one. It highlights how ETFs, which made up only about 10% of weekly flows in 2014, have grown to around 50% and continue to rise. They also appear to be less volatile, while mutual funds (the blue line) show larger swings both up and down.
Benefits of ETFs:
What are the perceived benefits of ETFs versus mutual funds?
- Instant liquidity – you have access to the funds the minute you sell them at that price. Mutual Funds, in most cases, funds are available at the end of the day at the end-of-day NAV price.
- Lower sales/management fees.
- More tax efficient. Unlike mutual funds, gains and losses are tied to your own investment activity. You realize either the gains or losses when you chose to transact. This is unlike mutual funds when you share in the fund’s activity.
- Index Focused: The ETF maintains full discretion of its investment activities via the investment policy. There are no active management decisions that could cause the investment to underperform or outperform versus mutual funds.
Total Returns by Fund Type:
Now for the big question: are ETF fees low enough to make up for the benefits of active management in mutual funds? MainLine compared five of the top municipal mutual funds and ETFs, looking at their fees and performance. The review focused on general long-term national funds benchmarked to the Bloomberg National Composite Index. Here’s what the analysis found:
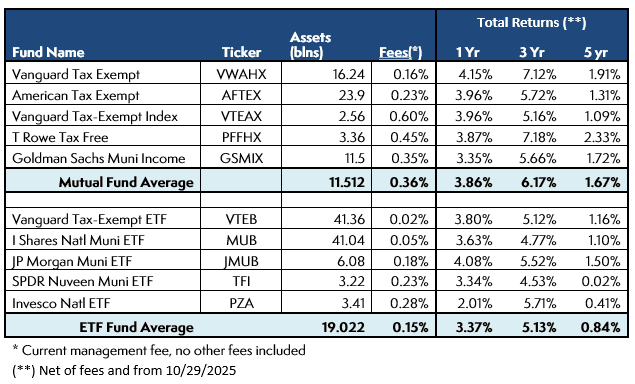
- ETF fees are on average lower by more than half. (15 bps versus 26 bps.)
- ETF returns are lower for every time-period analyzed:
- Lower 49 bps over 1 year
- Lower 104 bps over 3 years
- Lower 83 bps over 5 years
- This is a small sample size comparison of fund returns. Yet, there is some consistency and MainLine thinks there is a reason for it.
Conclusions:
So why are ETFs becoming so popular? MainLine believes there are several reasons:
- They offer a quick and easy way to gain exposure to the muni market. If an investor thinks muni prices are heading higher, ETFs make it simple to act on that view.
- They make performance easier for financial advisors to explain. Because ETFs are benchmarked to an index, once cash flows are factored in, returns tend to stay close to that benchmark.
- MainLine isn’t surprised that, over time, mutual funds tend to outperform ETFs. Active management has historically added enough value to offset the fee advantage of ETFs. The muni market has structural inefficiencies and niche opportunities that skilled managers can use to generate better income and performance than index-based strategies.
- MainLine still believes customized SMAs are the best option for investors looking to maximize tax-exempt income. Mutual funds come in second, while ETFs remain in distant last place.
In summary, while ETFs have gained popularity for their simplicity, accessibility, and transparency, MainLine believes that long-term investors seeking consistent tax-exempt income may be better served by active management or customized portfolios. The rapid growth of ETFs reflects investors’ desire for convenience and liquidity, but when it comes to capturing value in a complex market like munis, experience and selectivity still matter. MainLine continues to see the best opportunities in strategies that can take advantage of market inefficiencies rather than simply track them.