The growth in SMAs has led to an increase in competition by muni managers to gather more assets from Funds and other advisors. One way to do this is to index their performance and hopefully outperform, showing their value add. What tends to get lost in all this quantitative stuff, is whether the investor is really coming out ahead. This month, MainLine reviews the index of choice: The Bloomberg Municipal Composite Index. We will dissect it down – and then build it back up to the perfect SMA Indexed Portfolio, just for you!

Muni performance year to date has been pathetic, but MainLine sees life that should lead to at least a good next 30 to 60 days of performance. Year to date, munis are down .97% while US Treasuries are up 2.29%. What give us hope? Less market uncertainty, increased cash to invest, and wonderful tax equivalent yields. It has not been this good for a long time. Lock it in and let the high tax-exempt income flow for years.
Muni Market Review
Munis by month end are finally showing some improvement, and we think this could be just the beginning. Munis were up .05% for the month, but still down -.97% on the year. This still looks rough versus US Treasuries up 2.29% for the year, but down 1.24% for the month and US Corporates up 2.08% for the year, but down .19% for the month. Other May performance highlights:
- The muni yield curve steepened hard with short rates down 20 bps, and longer-term rates up 12 bps. Taxables were higher across the curve 24 to 22 bps.
- Year to date issuance is up 12% from 2024, led by higher education and electric utility issuance.
- Tax equivalent yields are near 15-year highs at over 7.5% on the longer end for AAA rated, more like 8% for AA essential service revenue bonds.
- Muni yield volatility is finally coming down giving some “fear relief” for retail muni investors.
Why do we see improvement going forward? The “Fear Index” is plunging taking away investor concerns and causing inflows to increase into munis, the market is moving into a positive technical time of year with big coupon and maturity inflows to investors, and tax equivalent yields are close to 15-year highs. MainLine is looking for a good summer for muni performance.
Market News & Credit Update
- Munis have, for the moment, survived the first big red wave. It appears the exempt status of munis will remain intact, and no sectors have been singled out to lose their exemption. The Big Beautiful Bill does not take away any of the exempt status from munis, no change in AMT, but it does contain an increase to the SALT (State & local Tax) exemption from $10,000 to $40,000. This will slightly impact the demand for muni bonds from high tax states like California & New York as it provides $30,000 more income protection from state income tax.
- The State of Maryland lost its’ Aaa Moody’s rating because of its exposure to shifting federal policies. Policies such as Federal Government layoffs, Federal funding cuts have wreaked havoc on the state’s budget that was already showing signs of weakness. State officials call it the “Trump Downgrade”.
MainLine West Family of Funds Update:
- The funds were able to take advantage over the last 30 days to lock in a new trust at these elevated levels. A housing PAC bond trust, which was up slightly on the year as outperformers were sold, and longer-duration premium-coupon bonds were bought to add duration and pick up income. The estimated payout of this new trust is 7% – 8 %. This is symbolic of the potential for Fund VIII.
- Fund raising for Fund VIII is in full force. The Fund is getting close to regulatory approval and subscriptions are starting to come in. Muni yields remain elevated, and a possible payout of 7% – 9% (Net IRR 10% – 12%).
Dissecting the Indexing Muni Market
Introduction:
There has been significant effort recently in the managed municipal space—particularly among SMAs—to identify a representative and reliable benchmark for evaluating portfolio performance. MainLine decided to investigate the current index of choice; “The Blomberg Municipal Bond Composite”. This index includes every CUSIPed tax-exempt municipal bond and includes general obligation, revenue, prerefunded, and insured bonds. It comprises over 66,400 bonds, market value of $3.7 trillion, maturing value of $4.7 trillion (includes zero coupons), itemized by sector, state of issuance, credit quality, and final maturity.
MainLine, with the help of our partners at Barclays, takes the time this month to slice, dice, add, subtract, and analyze what this composite looks like. If it’s going to become the “standard” for measuring muni performance, it’s important to clearly understand what that benchmark entails.
All information provided is as of April 28, 2025. Some reformatting and classification were needed to stay consistent and yet still provide a manageable analysis. Here is what MainLine found:
Index Sector Profile:
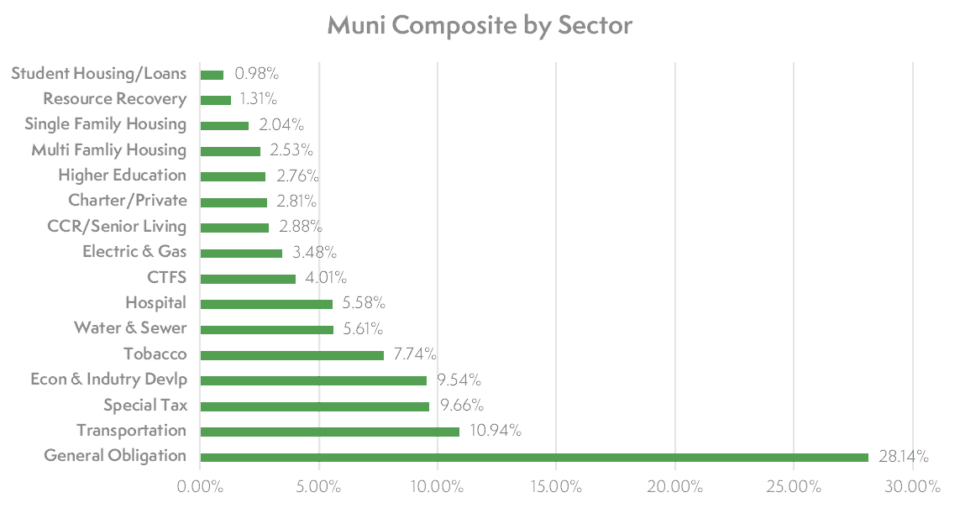
- Top outstanding sector is General Obligation at 28%.
- Top five outstanding sectors represents 66%:
- This includes industry development & tobacco revenue backed bonds.
- Essential services (General obligation, water/sewer, & electric/gas) make up 38%.
- “Somewhat essential” (Includes “essentials” plus hospital, single family housing, and special tax) represents 64%.
Index Credit Profile:
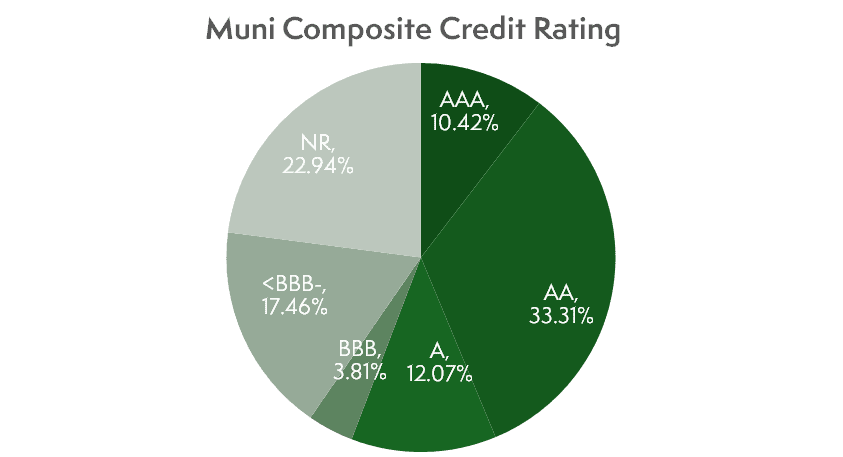
- 44% bonds outstanding are top tier credit quality AAA or AA+/- rated.
- 56% bonds are rated investment grade.
- 23% are non-rated.
- 40% are either below investment grade or not rated.
Index Maturity Profile:
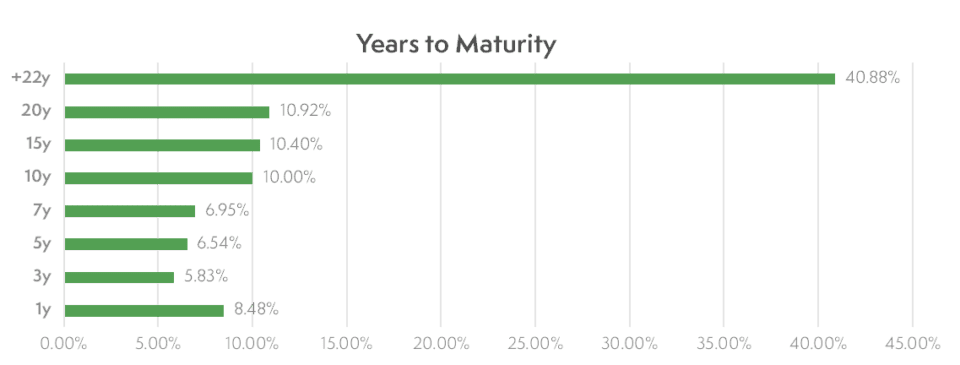
- Bonds issued for long-term projects: Over 40% of bonds are 22 years or longer in maturity.
- Strong retail demand creates overpriced shorter maturing bonds: Only 32% of bonds mature in less than ten years.
- 10% of bonds mature in less than one year making them money market eligible.
Index Geographic Profile:
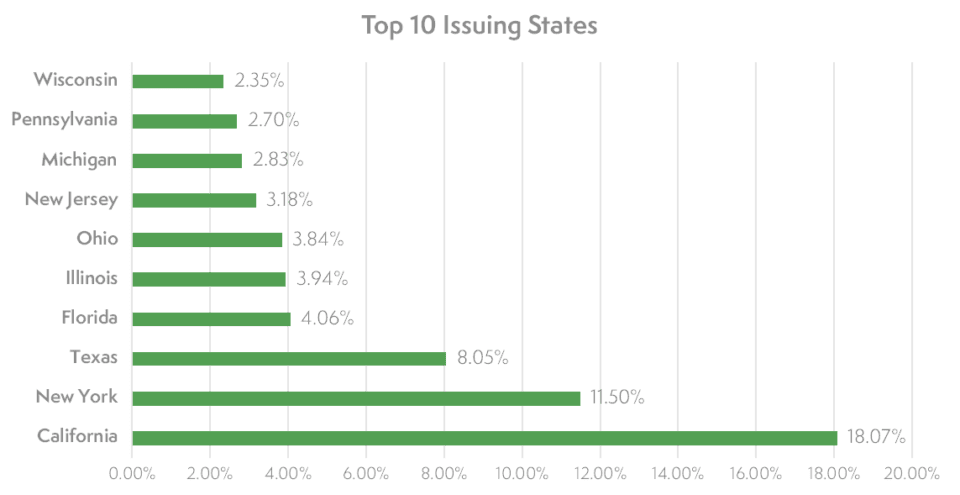
- Top five issuers represent almost half of the debt outstanding at 46%.
- Big states have big debt. Top ten issuers are 61% of the debt and represents 52% of the population.
- States without an income tax (nine of them) represents 16% of outstanding bonds.
- Puerto Rico, not listed in the top ten for the above information, represents 9.6%.
Index Summary:
As mentioned earlier, muni managers are using the Bloomberg Composite as the benchmark to track their performance. What did we learn about the index?
- Over half of issuance is essential/somewhat essential, and for the public good.
- There are a lot non-rated and lower quality bonds in the Composite.
- The larger the state, the greater its debt load, regardless of whether it leans blue or red politically.
- Long-term in issuance, yet every bond is callable ten years or shorter. This keeps fewer bonds under ten years in final maturity as they are very often called and refinanced.
The Perfect Index Portfolio?
MainLine is not a big fan of indexing; we design portfolios based on client needs, maximizing income and tax-efficiencies. MainLine looks to customize and does not try to imitate an index, but if it did, what would the perfect SMA Bloomberg Composite look like?
- Long bonds, at least 40% 22 years or longer.
- 40% non-rated or below investment grade rated.
- 50% from the big states, like California, New York, Texas, Florida and Illinois, with no focus on the resident’s home state.
- 66% essential service plus tobacco-backed bonds with zero coupons.
There you go, the perfect indexed created SMA portfolio – just what the principal-first non-big state investor wants. Does that sound like a SWAN (sleep well at night), tax efficient portfolio?
That approach might work for other muni managers focused on indexing, but at MainLine West, we prioritize safe, high-income investments with a favorable risk/return profile tailored specifically for you!